

Ticker case study
NVIDIA Seasonality: A Historical Window, Tested More Carefully
A transparent NVIDIA seasonality case study using 2010–2025 data, an algorithmic window search, and an untouched out-of-sample check.
Open, high, low, and close percentage changes for each completed year in the selected window. Historical context, not a forecast.
NVIDIA has had exceptional long-term growth, which makes any historical seasonal result especially easy to overread. This case study therefore starts with the selection method rather than a headline percentage.
We used adjusted daily NVDA closes from Yahoo Finance and completed calendar years from 2010 through 2025. The current year, 2026, is excluded from every statistic.
Method before result
An algorithm scanned start dates every seven calendar days and holding periods from 30 to 120 days. Weekend and holiday dates use the preceding close. It selected one long-only window using only 2010–2021 data, requiring at least 58% positive years and a positive median return.
The ranking metric was train-period median return multiplied by train-period win rate. This is a disclosed search process, not a claim that the discovered window is a future signal.
The selected historical window
The selected window was July 29 to November 26, a 120-calendar-day holding period. In the 2010–2021 selection sample, 10 of 12 years were positive. The median return was +25.4%, while the worst historical year was -39.2%.
Those numbers are descriptive. They show why this window earned further inspection, not why it should be traded.
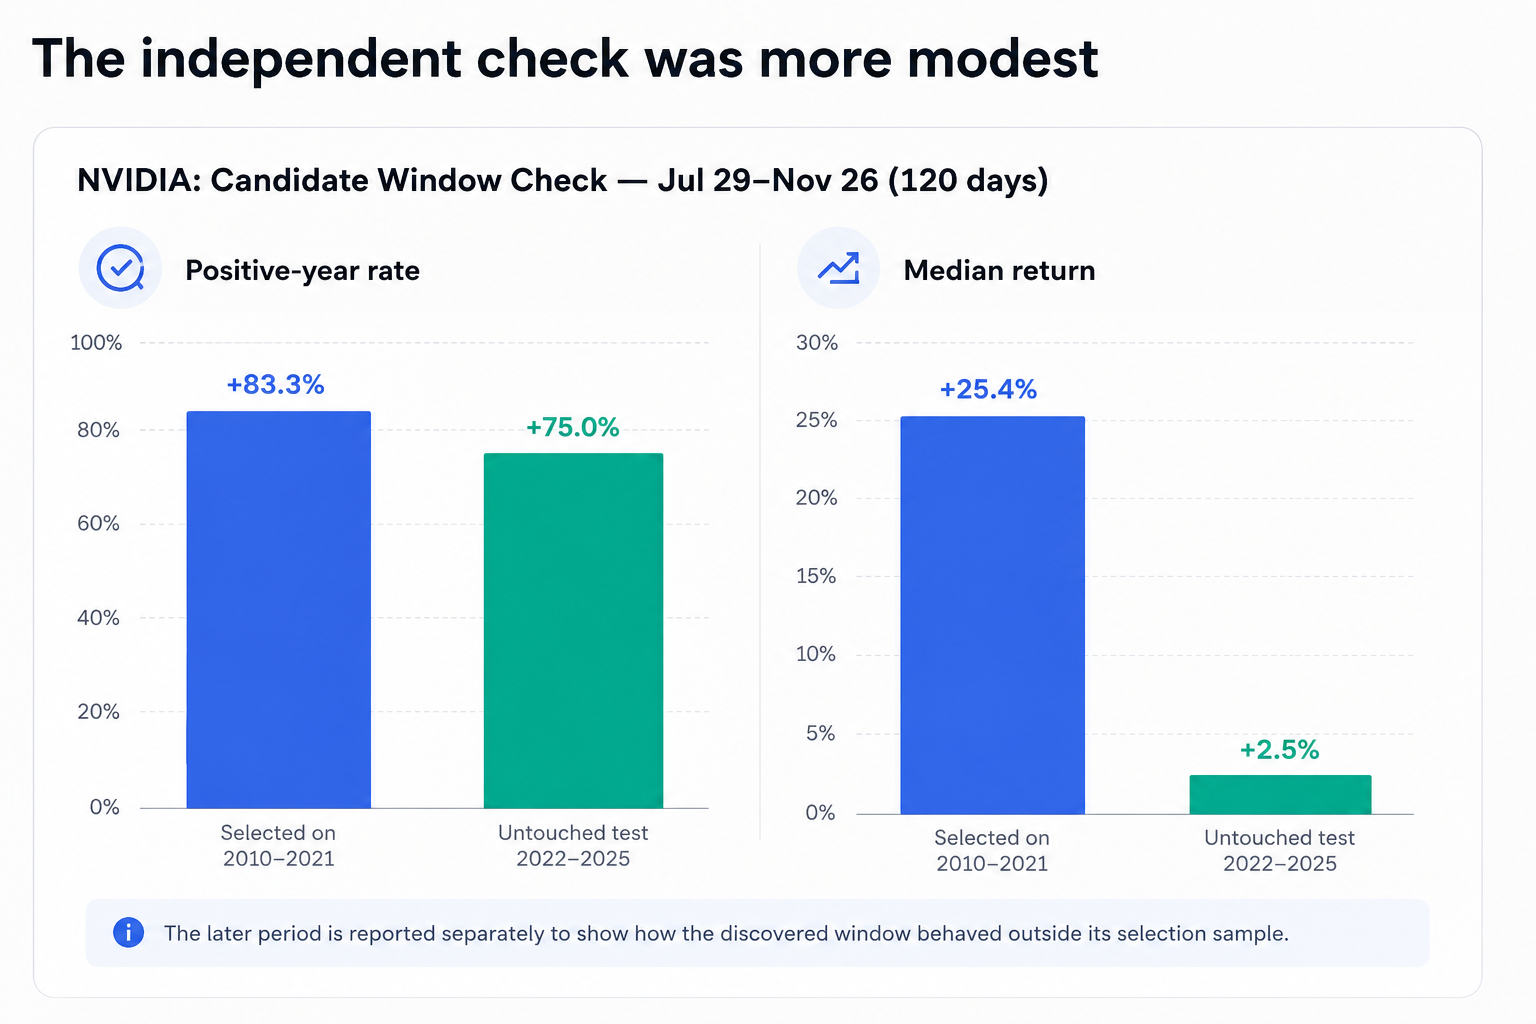
From 2022 through 2025, three of four years were positive, but the median return was only +2.5%. This gap is the useful insight: the window remained mostly positive in the held-out period, yet its typical outcome was far smaller than the selection-period result.
Weak years matter
The completed sample includes a -39.2% result in 2018 and a -10.4% result in 2022. They are not footnotes. They demonstrate the risk hidden behind a strong long-term percentage and show why annual distribution matters more than a single average.
What this does and does not show
This is a reproducible historical observation for one stock and one disclosed selection process. It does not account for future earnings, valuation, macro conditions, or changes in NVIDIA’s business and market structure.
Use the public NVIDIA seasonality page to explore broader history, or open Ticker Analysis for NVDA to inspect other windows. For methodology, see How to Read Backtests and Historical Market Patterns vs. Trading Signals.
Look at the window, not just the headline.
Compare seasonal history for a stock you already follow, then decide whether the context is worth further research.
Historical patterns describe past market behaviour. They do not predict future returns and are not investment advice.