

Backtesting research
How to Read Backtests: A Practical Guide to Historical Market Research
Learn how to assess a market backtest by checking its rules, sample size, return distribution, weak periods, and sensitivity to changing conditions.
A clean equity curve can make an idea feel proven.
The average return is positive. The percentage of winning years looks encouraging. A historical chart slopes upward from left to right. It is easy to look at those results and imagine that the difficult work has already been done.
It has not.
A backtest is not proof that a rule will work in the future. It is a structured record of what happened when a specific rule was applied to historical data. Its value is not certainty. Its value is that it turns a vague market belief into a question that can be inspected.
Start by making the rule visible
Many ideas begin with a sentence such as: “This stock usually performs well in this period.” That statement leaves almost every important detail unanswered.
Which stock? Which dates? How is entry defined? When is the position closed? What data is included? Would the result survive if the dates moved by a few days?
Universe + window + sample + rules
For seasonality, the window is the exact entry and exit period. The sample is the set of historical years. The rules define how returns are calculated and how missing trading days or holidays are handled.
Making those inputs explicit does not make a result predictive. It does make it possible to understand what was actually tested.
The average is not the whole pattern
An average is a shortcut. It can be helpful, but it can also hide the structure of the history.
Two windows can have the same average return for very different reasons. One may have delivered many modest positive outcomes with manageable losses. Another may owe most of its average to one or two unusually strong years while the rest of the sample was uneven.
Those are different research results, even if the headline percentage is identical.
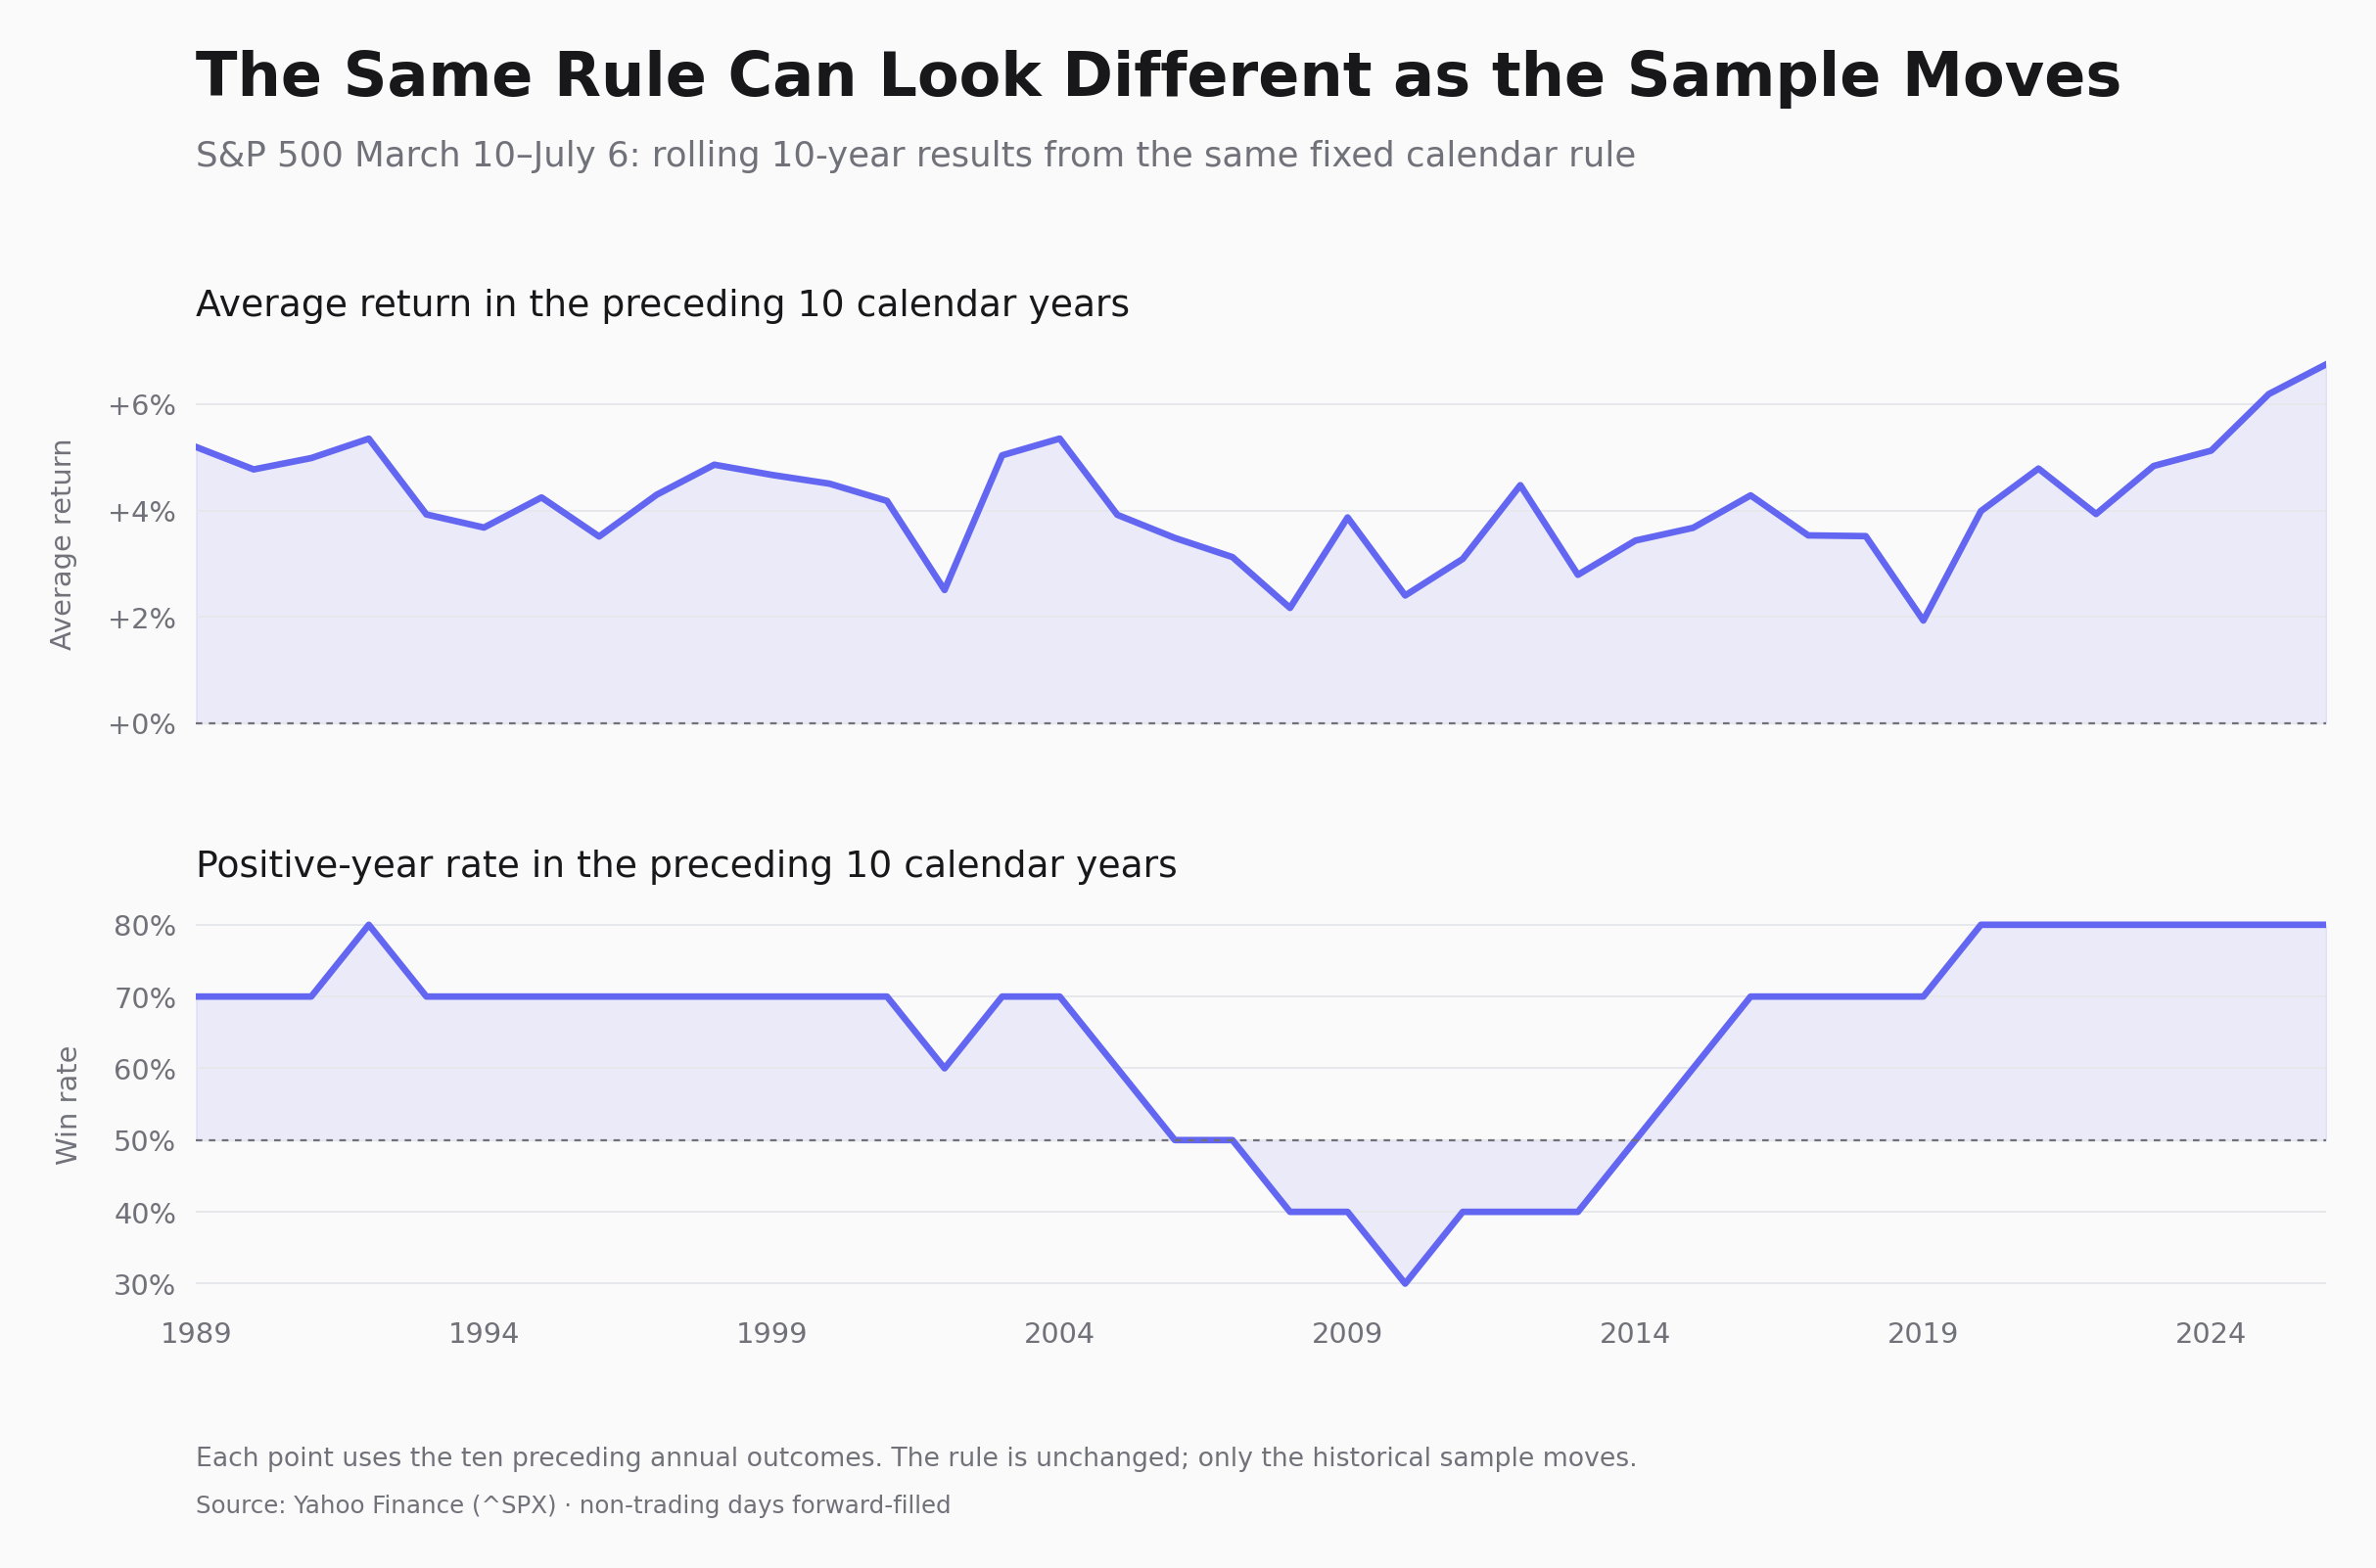
The chart above uses a fixed S&P 500 calendar window and calculates its trailing ten-year win rate and average return over time. The rules stay the same; the historical sample changes. The range of results is the point. A conclusion that looks obvious in one period can look much less stable when the sample moves.
Before relying on any average, inspect the individual outcomes. How wide is the distribution? Are positive periods broadly represented? Did a few outliers drive the result? How severe were the losses?
The average can start the conversation. It should not end it.
Sample size changes the conversation
A pattern observed over six years is not the same as one observed over twenty-five. Neither result is automatically useful or useless, but they require different levels of caution.
With a small sample, one extraordinary year can dominate the average. Narrow date windows can create another problem: moving the entry or exit date slightly may change the result substantially. If overlapping periods are treated as independent observations, the apparent sample can be larger than the real one.
A larger sample gives you more historical context. It does not guarantee that the next year will resemble the past. It simply provides more evidence to examine.
Read the weak years first
The strongest years are easy to admire. The weak periods are where a backtest becomes informative.
Look for the years or regimes in which the rule struggled. Were losses concentrated in bear markets? Did the pattern weaken when inflation rose, rates changed, or sector leadership shifted? Did it recover quickly, or was the drawdown long enough to make the strategy difficult to hold?
A historical result can look attractive in a summary report and still have a path that most people would find difficult in real time. That does not invalidate the research. It tells you what the research actually contains.
Ignoring the weak periods is not risk management. It is editing the record.
Check for overfitting
Overfitting happens when a rule has been adjusted until it fits its own historical data too neatly. The more variations you test, the easier it becomes to find a window that looks exceptional by chance.
- Very specific dates with no clear rationale.
- A result that disappears after a small date change.
- Performance driven by a few observations.
- Many attempted rules but only one published result.
- No comparison with a sensible benchmark.
The answer is not to abandon testing. It is to be honest about the number of choices made while designing the test, and to see whether the idea remains useful outside the period that inspired it.
A practical reading order
- Read the rule. Identify the market, direction, dates, and calculation assumptions.
- Check the sample. Count the years and look for overlaps or narrow windows.
- Inspect the distribution. Review individual outcomes, not only the average and win rate.
- Study the weak years. Ask what market conditions were present when the pattern failed.
- Compare horizons. Look at full history and recent history separately.
- Add current context. A backtest cannot replace an independent view of the market today.
This turns a backtest into a research workflow instead of a shortcut to a conclusion.
Start with a ticker you already follow. Define a window in Ticker Analysis, then compare it with public seasonal history for Microsoft, NVIDIA, or Amazon. If you want a broader starting set, review current opportunities.
The purpose is not to turn history into a prediction. It is to make the past clear enough to challenge an idea before you rely on it.
Look at the window, not just the headline.
Compare seasonal history for a stock you already follow, then decide whether the context is worth further research.
Historical patterns describe past market behaviour. They do not predict future returns and are not investment advice.