

Stock seasonality
Seasonal Patterns in Stocks: What They Can Tell You — and What They Cannot
Learn what stock seasonality is, why recurring calendar patterns appear, and how to use historical windows without treating them as predictions.
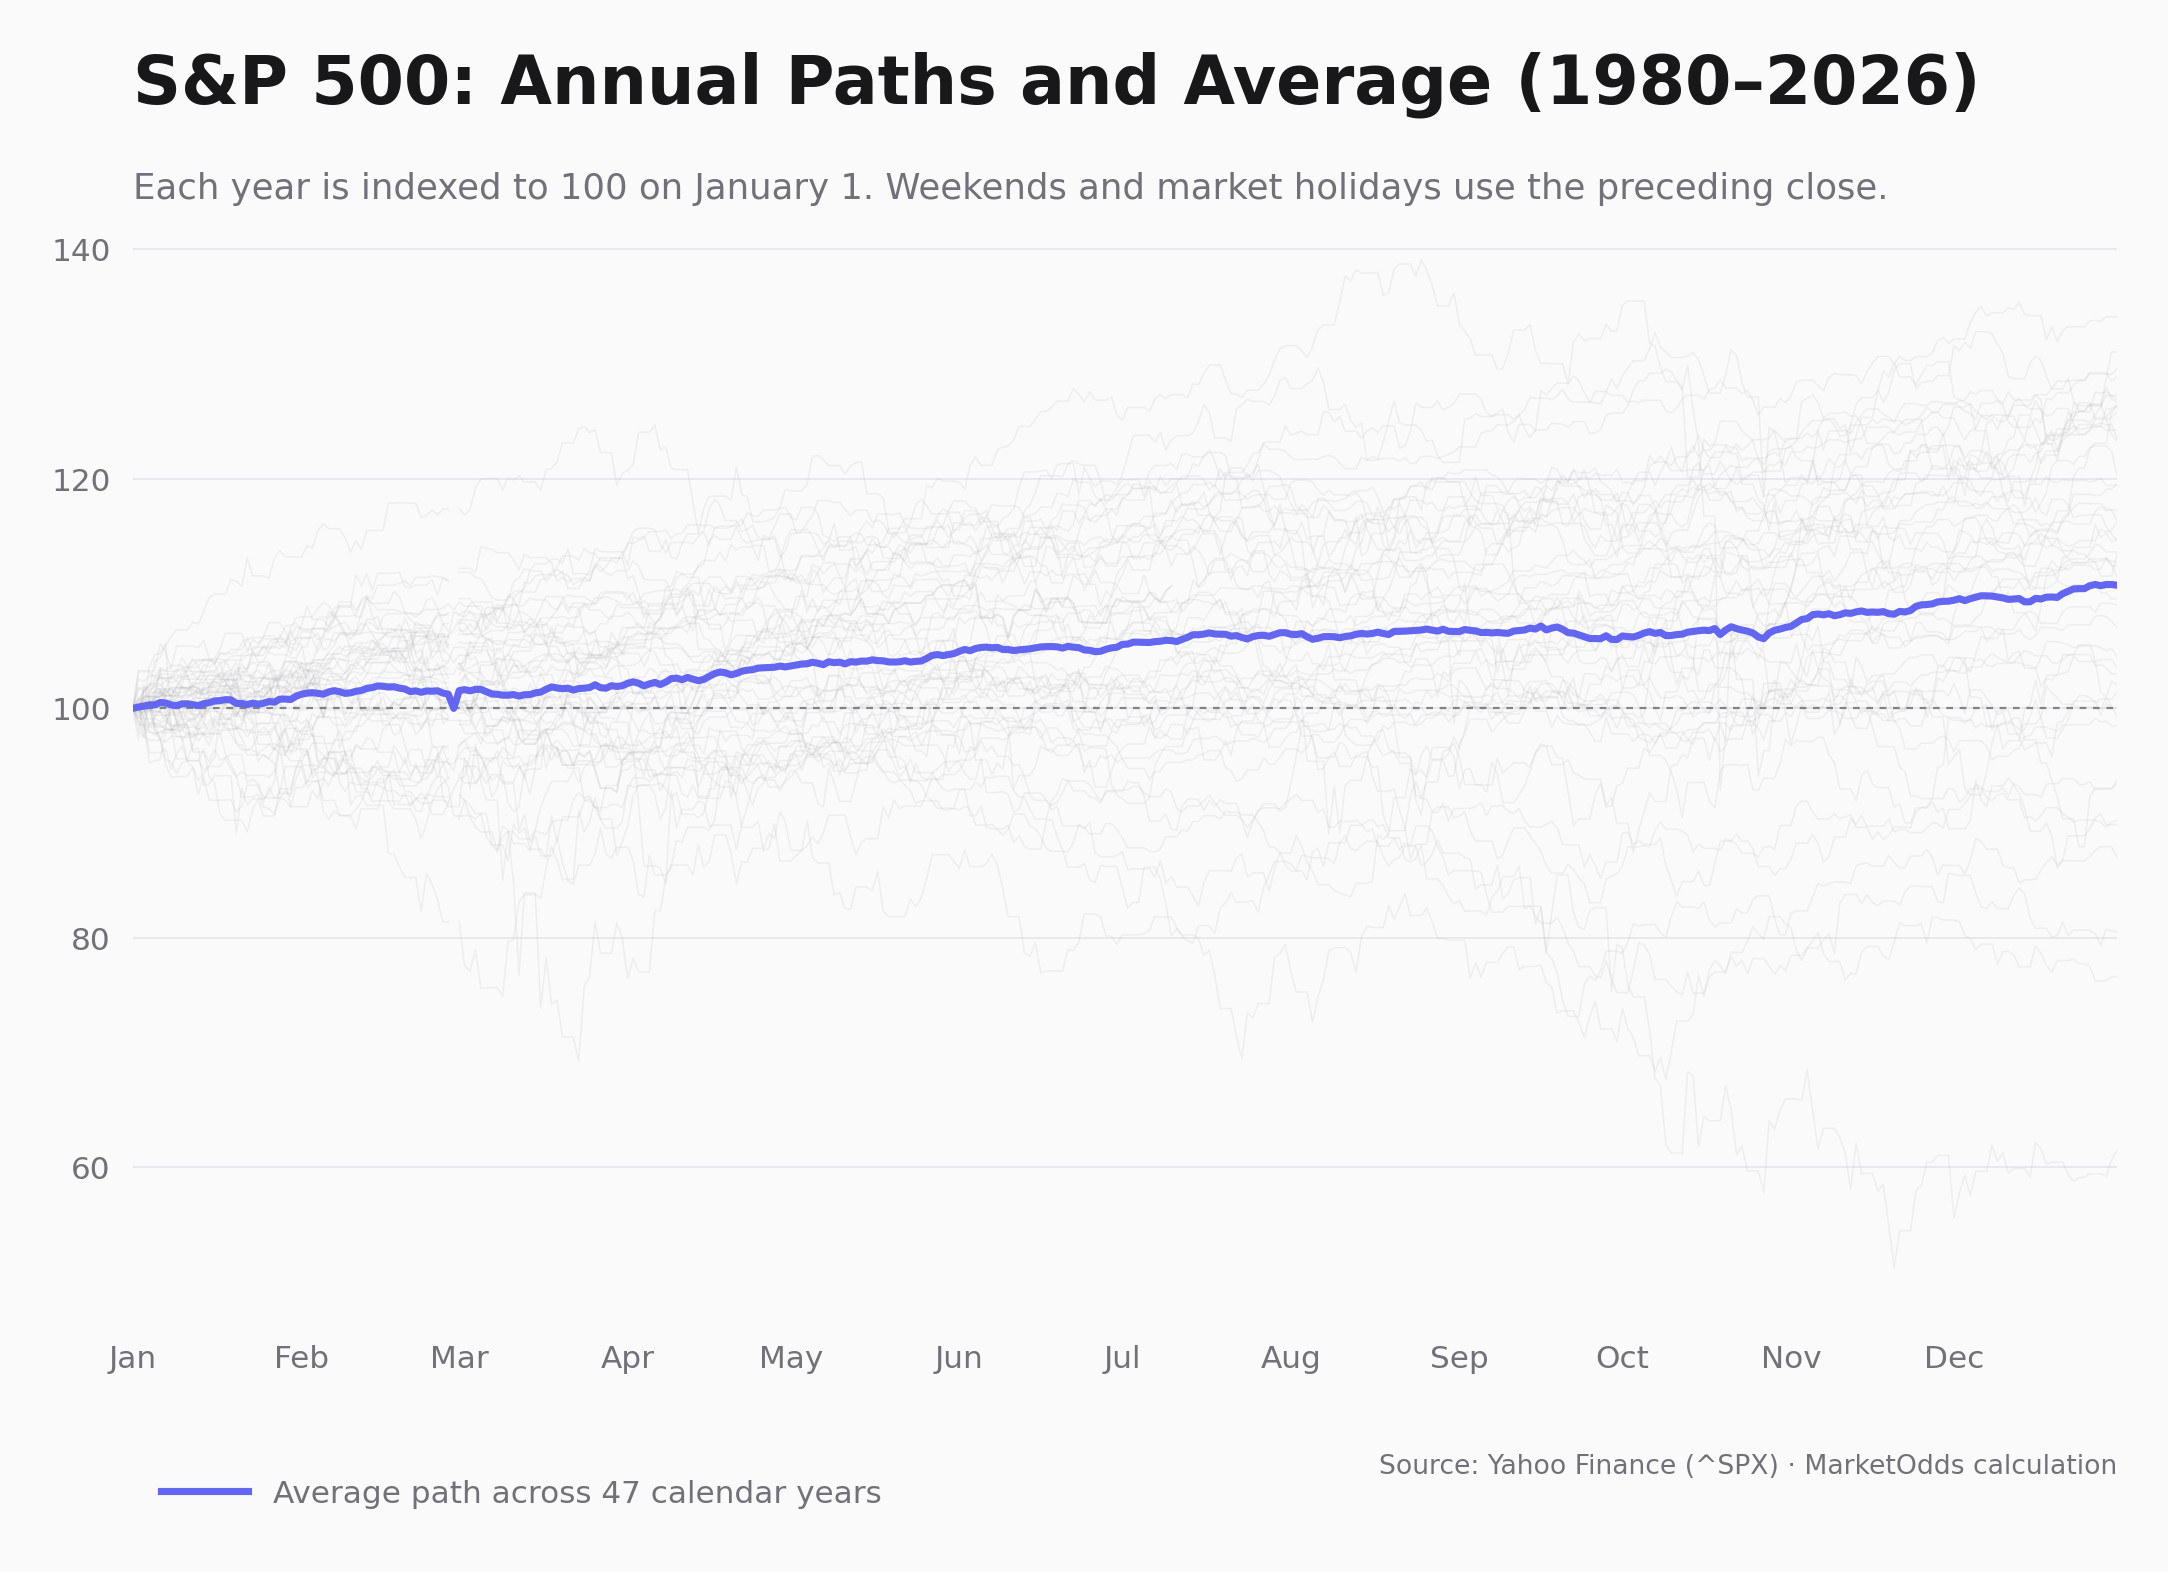
There is a recurring moment in market research when a number starts to feel more certain than it really is.
A stock has performed well from March to July in most of the last twenty years. The chart has a clean upward slope. The win rate looks persuasive. It is tempting to turn that observation into a conclusion: this is the time to buy.
That is usually where the quality of the research begins to decline.
Seasonality is useful because it gives us a way to look at the same calendar window across many different market environments. It is not useful because it tells us what the next trade must be. The distinction is small on paper, but important in practice.
At MarketOdds, we look at seasonality as historical context. A seasonal window can help you notice when a stock, sector, or index has tended to behave differently at a certain time of year. It can also show you how often that idea failed, how large the losing periods were, and whether the recent history looks different from the long-term record.
That is a much better starting point than a calendar cliché.
What stock seasonality actually means
Stock seasonality is the study of how an asset behaved during the same part of the calendar year over many past years.
For example, you might look at how Microsoft performed between March 10 and July 6 in each of the last twenty years. Or you might compare the S&P 500's typical path from late summer into year-end. The dates, holding period, market, and sample are all part of the definition. Without them, a statement such as “this stock is strong in spring” is too vague to be useful.
The point is not to find a magical date. It is to make the historical question precise:
How did this exact window behave across a range of past conditions?
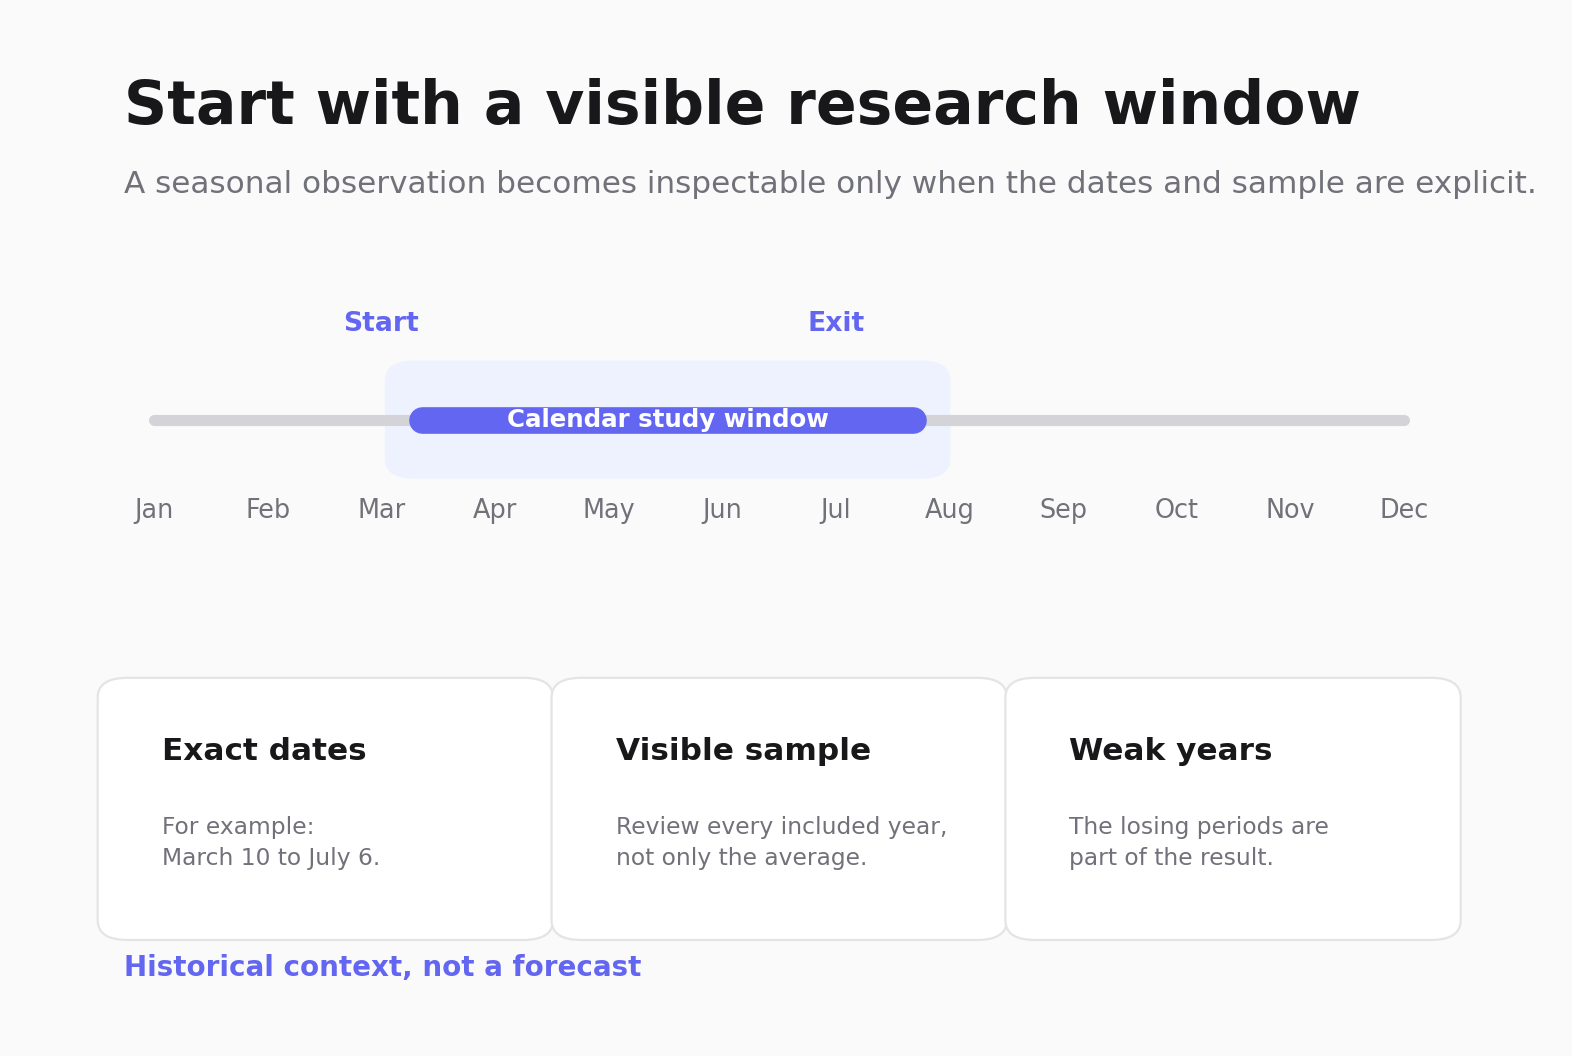
Once the question is defined clearly, the result becomes easier to inspect. You can look beyond a single average return and see the shape of the history: the good years, the bad years, the outliers, and the periods when the pattern simply did not show up.
Why can calendar patterns appear in the first place?
Markets are not governed by a calendar. Businesses and investors, however, often are.
Tax deadlines, year-end rebalancing, pension contributions, earnings cycles, dividend reinvestment, vacations, inventory planning, and institutional reporting periods can all affect when capital moves and how actively people trade. Some influences are economic. Others are behavioural. Many are temporary.
That is why seasonality is plausible without being permanent.
A pattern can have a sensible explanation and still weaken. Once enough participants know about an effect, their actions can change it. A market dominated by new sector leadership, different interest-rate conditions, or a major macro shock can also behave nothing like its historical average. The history is still real; it is simply not a promise.
Four seasonal ideas investors hear about most often
The January Effect
The January Effect usually refers to the tendency for smaller companies to perform relatively well at the beginning of the year. One common explanation is year-end tax-loss selling: investors may sell weak positions in December, then buying returns after the new year. Fresh allocations and portfolio rebalancing may contribute as well.
The important part is not the slogan. It is the scope. The effect has often been discussed in small-cap stocks, not as a universal rule that every stock rises in January. Even when a broad index is positive, the behaviour of individual names can vary widely.
If you are researching a January window, check the asset and sample rather than assuming the label applies to everything.
“Sell in May and go away”
This is probably the best-known seasonal phrase in the market. It describes the historical observation that returns from roughly November through April have sometimes been stronger than returns during the May-to-October period.
It is memorable because the phrase is simple. The actual market history is not.
There have been summers when the pattern appeared to fit the data, and others when staying out of the market would have meant missing a strong rally. A seasonal tendency may be worth reviewing as one part of a broader market picture. It is not a reason to exit an entire portfolio on a date in May.
The Santa Claus Rally
The Santa Claus Rally refers to the final trading days of December and the first few days of January. The period has historically been associated with positive returns often enough to attract attention.
There are familiar explanations: lighter holiday trading, optimism around the new year, bonus flows, tax positioning, and year-end portfolio adjustments. But the pattern is not a yearly appointment. In weak market regimes, it may not appear at all.
The useful question is not whether the rally is “real.” It is whether the current calendar window has a meaningful record for the market or stock you are studying, and whether the downside in the years it failed is acceptable in your own process.
The turn-of-the-month effect
The turn-of-the-month effect focuses on the final few trading days of one month and the first few of the next. Payroll contributions, fund flows, dividends, and recurring institutional activity are often cited as possible reasons.
It is a good example of why exact dates matter. “The beginning of the month” is not a testable rule until you decide how many days belong in the window, what happens on holidays, and which market you are measuring.
Once those rules are visible, you can test them. Before that, you only have a story.
A historical average can hide a difficult experience
Suppose a seasonal window has a positive average return. That sounds encouraging, but it does not tell you whether the gains were steady or whether two exceptional years did most of the work.
The same applies to win rate. A window that was profitable in 16 out of 22 years may still have had several painful losing periods. Those losing years are not a footnote. They are part of the result.
When reviewing a seasonal pattern, start with these questions:
- What are the exact start and end dates?
- How many years are included?
- How did the window behave in its weakest years?
- Is the average being pulled up by a small number of outliers?
- Does the recent five- or ten-year history look materially different from the full sample?
- What was happening in the market when the pattern broke down?
This is where a chart and a yearly return distribution are more useful than a large percentage displayed on its own.
Long history and recent history can tell different stories
A long sample gives you more observations. It also includes market structures that may no longer exist in the same form.
Recent history may better resemble the current market, but it is a much smaller sample and can be heavily influenced by one unusual cycle. Neither view is sufficient by itself.
That is why it helps to compare several horizons. If a pattern looks stable across the full history, the last ten years, and the last five years, that is worth noting. If the lines diverge sharply, that is useful information too. It may suggest that the historical effect has changed, or that the shorter period is simply too small to support a confident conclusion.
How to use seasonality without turning it into a signal
The practical role of seasonality is to narrow your attention, not to make the decision for you.
Imagine you already follow a company. Earnings, valuation, trend, volatility, and the broader market still matter. A seasonal window may add context: perhaps the coming period has historically been favourable, perhaps it has often been difficult, or perhaps the record is mixed enough that it should not influence the decision at all.
A disciplined workflow is straightforward:
- Start with a stock or market you already want to research.
- Define the calendar window instead of relying on a general label.
- Review the sample size and the losing years.
- Compare the long-term result with the recent record.
- Look at current conditions independently of the seasonal data.
- Decide whether the historical context deserves any weight in your research.
There is no rule saying every pattern needs to be acted on. Often the correct conclusion is simply: interesting history, insufficient reason to do anything.
Look at the window, not just the headline.
Compare seasonal history for a stock you already follow, then decide whether the context is worth further research.
Historical patterns describe past market behaviour. They do not predict future returns and are not investment advice.