

Backtesting research
How Accurate Is Seasonal Backtesting?
Learn what seasonal backtesting can measure, why a historical win rate is not a forecast, and how sample size affects confidence.
Seasonal backtesting can be accurate about the past. It cannot be certain about the future.
When a seasonal window shows a 70% win rate, the calculation may be perfectly correct: the asset finished positive in 7 of 10 historical periods. The mistake is to read that number as a 70% probability that the next period will finish positive.
The sample may be small, conditions may have changed, and the result may have been shaped by a few unusual years.
What a seasonal backtest measures
A seasonal backtest applies the same calendar rule across historical years. For example: enter on a chosen date, exit on another date, and calculate the result for each year in the sample.
The output can show the number of positive and negative years, average and median returns, the best and worst periods, the distribution of outcomes, and whether recent history differs from the full sample.
Those are useful measurements. They describe the historical record under clear rules. They are not a guarantee or an investment recommendation.
Why sample size matters
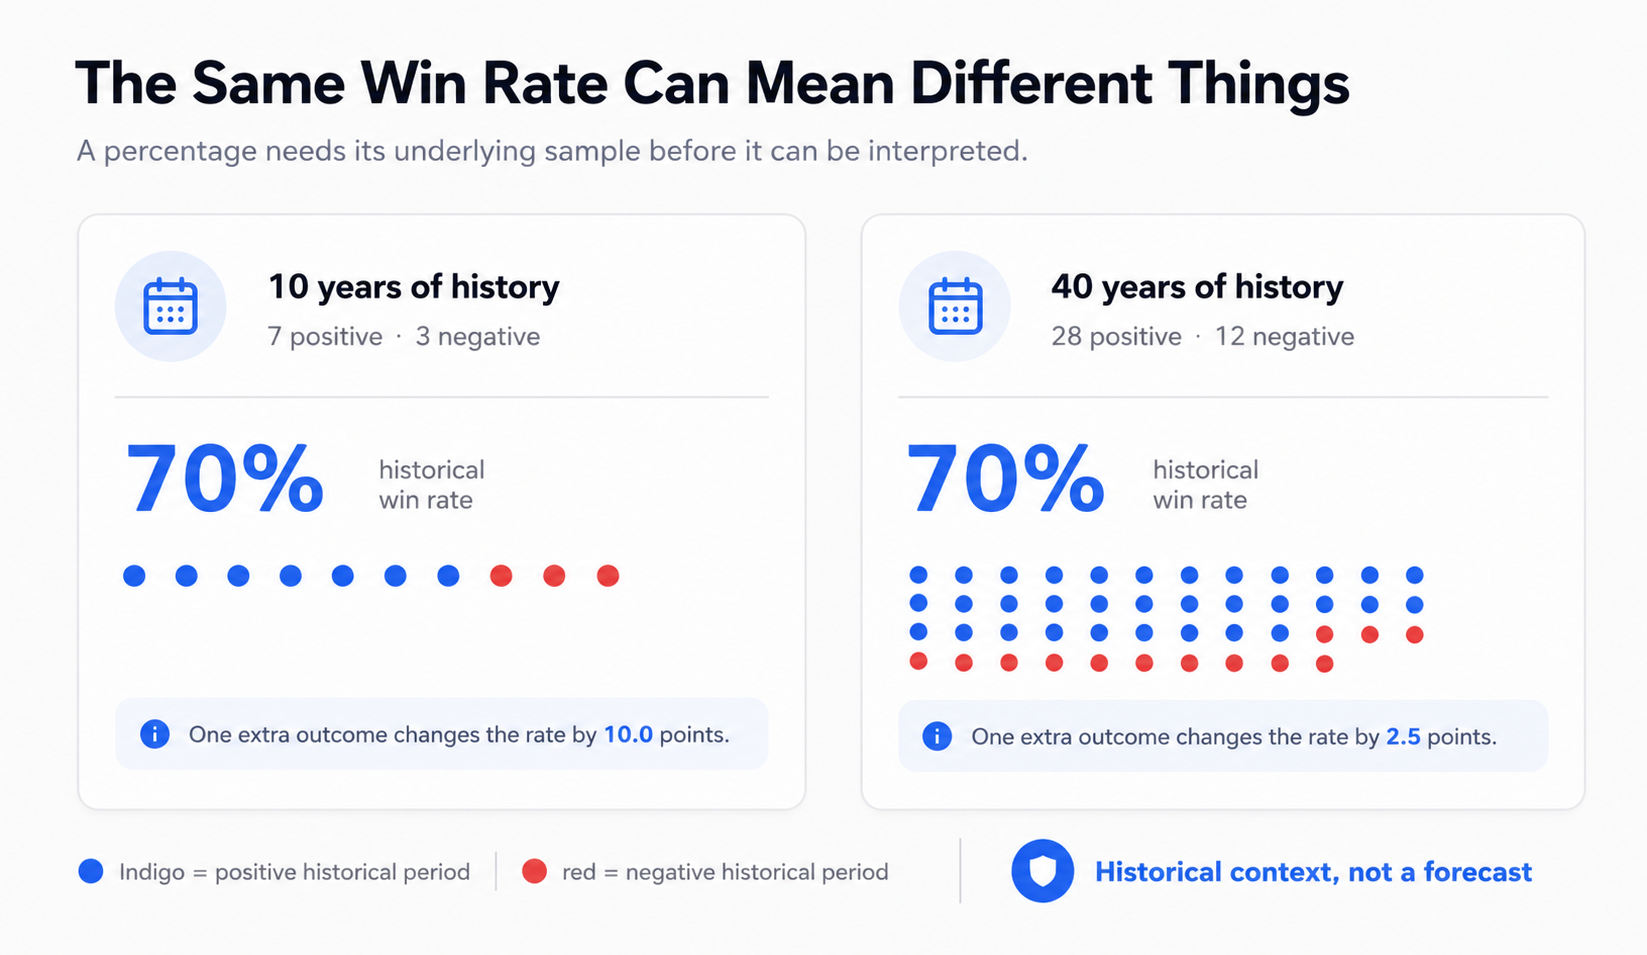
Ten years of history may sound meaningful, but it contains only ten annual observations. A 70% win rate is seven positive years and three negative years. One additional outcome changes it to 80% or 60%.
With forty years of history, one year changes the percentage much less. That does not make the longer sample predictive, but it gives the observation more context and makes it less vulnerable to a single outlier.
The graphic above visualises this simple difference. The same 70% historical win rate represents a much less stable observation with ten years than with forty.
Accuracy is more than win rate
The win rate counts direction. It does not measure the size of gains or losses.
A pattern can win often but lose badly in the years it fails. Another can have a lower win rate but a more balanced distribution. Neither result can be understood from one percentage alone.
- Check the exact entry and exit dates.
- Count the available years.
- Review the individual annual returns.
- Look at the worst periods and their context.
- Compare average with median return.
- Compare full history with recent history.
Historical accuracy can change
Market behaviour is not fixed. A calendar effect can weaken as market structure changes, capital flows shift, or a known pattern becomes crowded. Recent history may look better or worse than the long-term record for reasons that are not visible in the average.
Treat a seasonal backtest as a filter, not an instruction. A favourable record may justify more research. A weak or unstable record may be a reason to wait. Neither result makes the decision for you.
A useful standard for reading results
The honest answer to “How accurate is seasonal backtesting?” is: it is as accurate as its clearly defined calculation, and as limited as its sample and assumptions.
Use Ticker Analysis to inspect a specific stock’s seasonal history. Then review public examples for Microsoft, NVIDIA, and Amazon. Focus on the full distribution and weak years before you give a headline percentage much weight.
Look at the window, not just the headline.
Compare seasonal history for a stock you already follow, then decide whether the context is worth further research.
Historical patterns describe past market behaviour. They do not predict future returns and are not investment advice.