

Historical pattern research
Historical Market Patterns Are Not Signals
How to use a seasonal win rate or backtest as research context without mistaking historical outcomes for a prediction.
A number can become persuasive long before it becomes useful.
You see a 78% win rate for a calendar window. The chart points upward. The average return is positive. It takes only a few seconds for a historical observation to turn into a story about what should happen next.
That is the part worth resisting.
Historical data can be valuable. It can tell you where to look more closely, which periods were unusually difficult, and whether an idea has survived more than one market regime. What it cannot do is remove uncertainty or make the next outcome obvious.
At MarketOdds, a seasonal result is context. It describes what happened under a defined set of dates and rules in the past. It does not tell anyone what to buy, sell, or expect tomorrow.
A percentage is an observation, not a forecast
Take a statement such as: “This window worked in 17 of the last 22 years.” It may be interesting. It is not yet enough to act on.
Before the percentage means anything, the underlying question needs to be visible. What were the exact dates? Was the position long or short? How were holidays handled? Did the result depend on one or two unusually strong years? What did the losing years look like?
Those details change the meaning of the same headline number.
A win rate only counts direction. It does not tell you whether the winning years were modest and the losing years severe. It does not tell you whether the most recent decade looks anything like the long-term record. It does not tell you whether a change in rates, earnings expectations, volatility, or sector leadership has made the old comparison less relevant.
The right reaction to a strong percentage is not confidence. It is curiosity.
A seasonal window needs boundaries
“Strong in spring” is not a rule. It is a loose description.
A proper historical study has a start date, an exit date, a market, a sample, and a clear calculation method. Once those pieces are defined, somebody else can examine the same window and understand what was measured.
That is why MarketOdds puts the dates directly in the analysis. A visible window is more honest than a vague seasonal label. It lets you see what the claim actually includes and makes it easier to compare a full history with the last ten or five years.
The result may still be useful. It may also become less compelling once the assumptions are exposed. Both outcomes are part of good research.
The losing years carry the useful information
Most people look at a historical report and go straight to the largest number. Usually that is the win rate. The more revealing part is often below it.
Look at the years when the pattern did not work. Were the losses small and ordinary? Did they arrive during broad bear markets? Were they clustered around a particular macro environment? Or did the pattern fail in a way that would have been difficult to hold through?
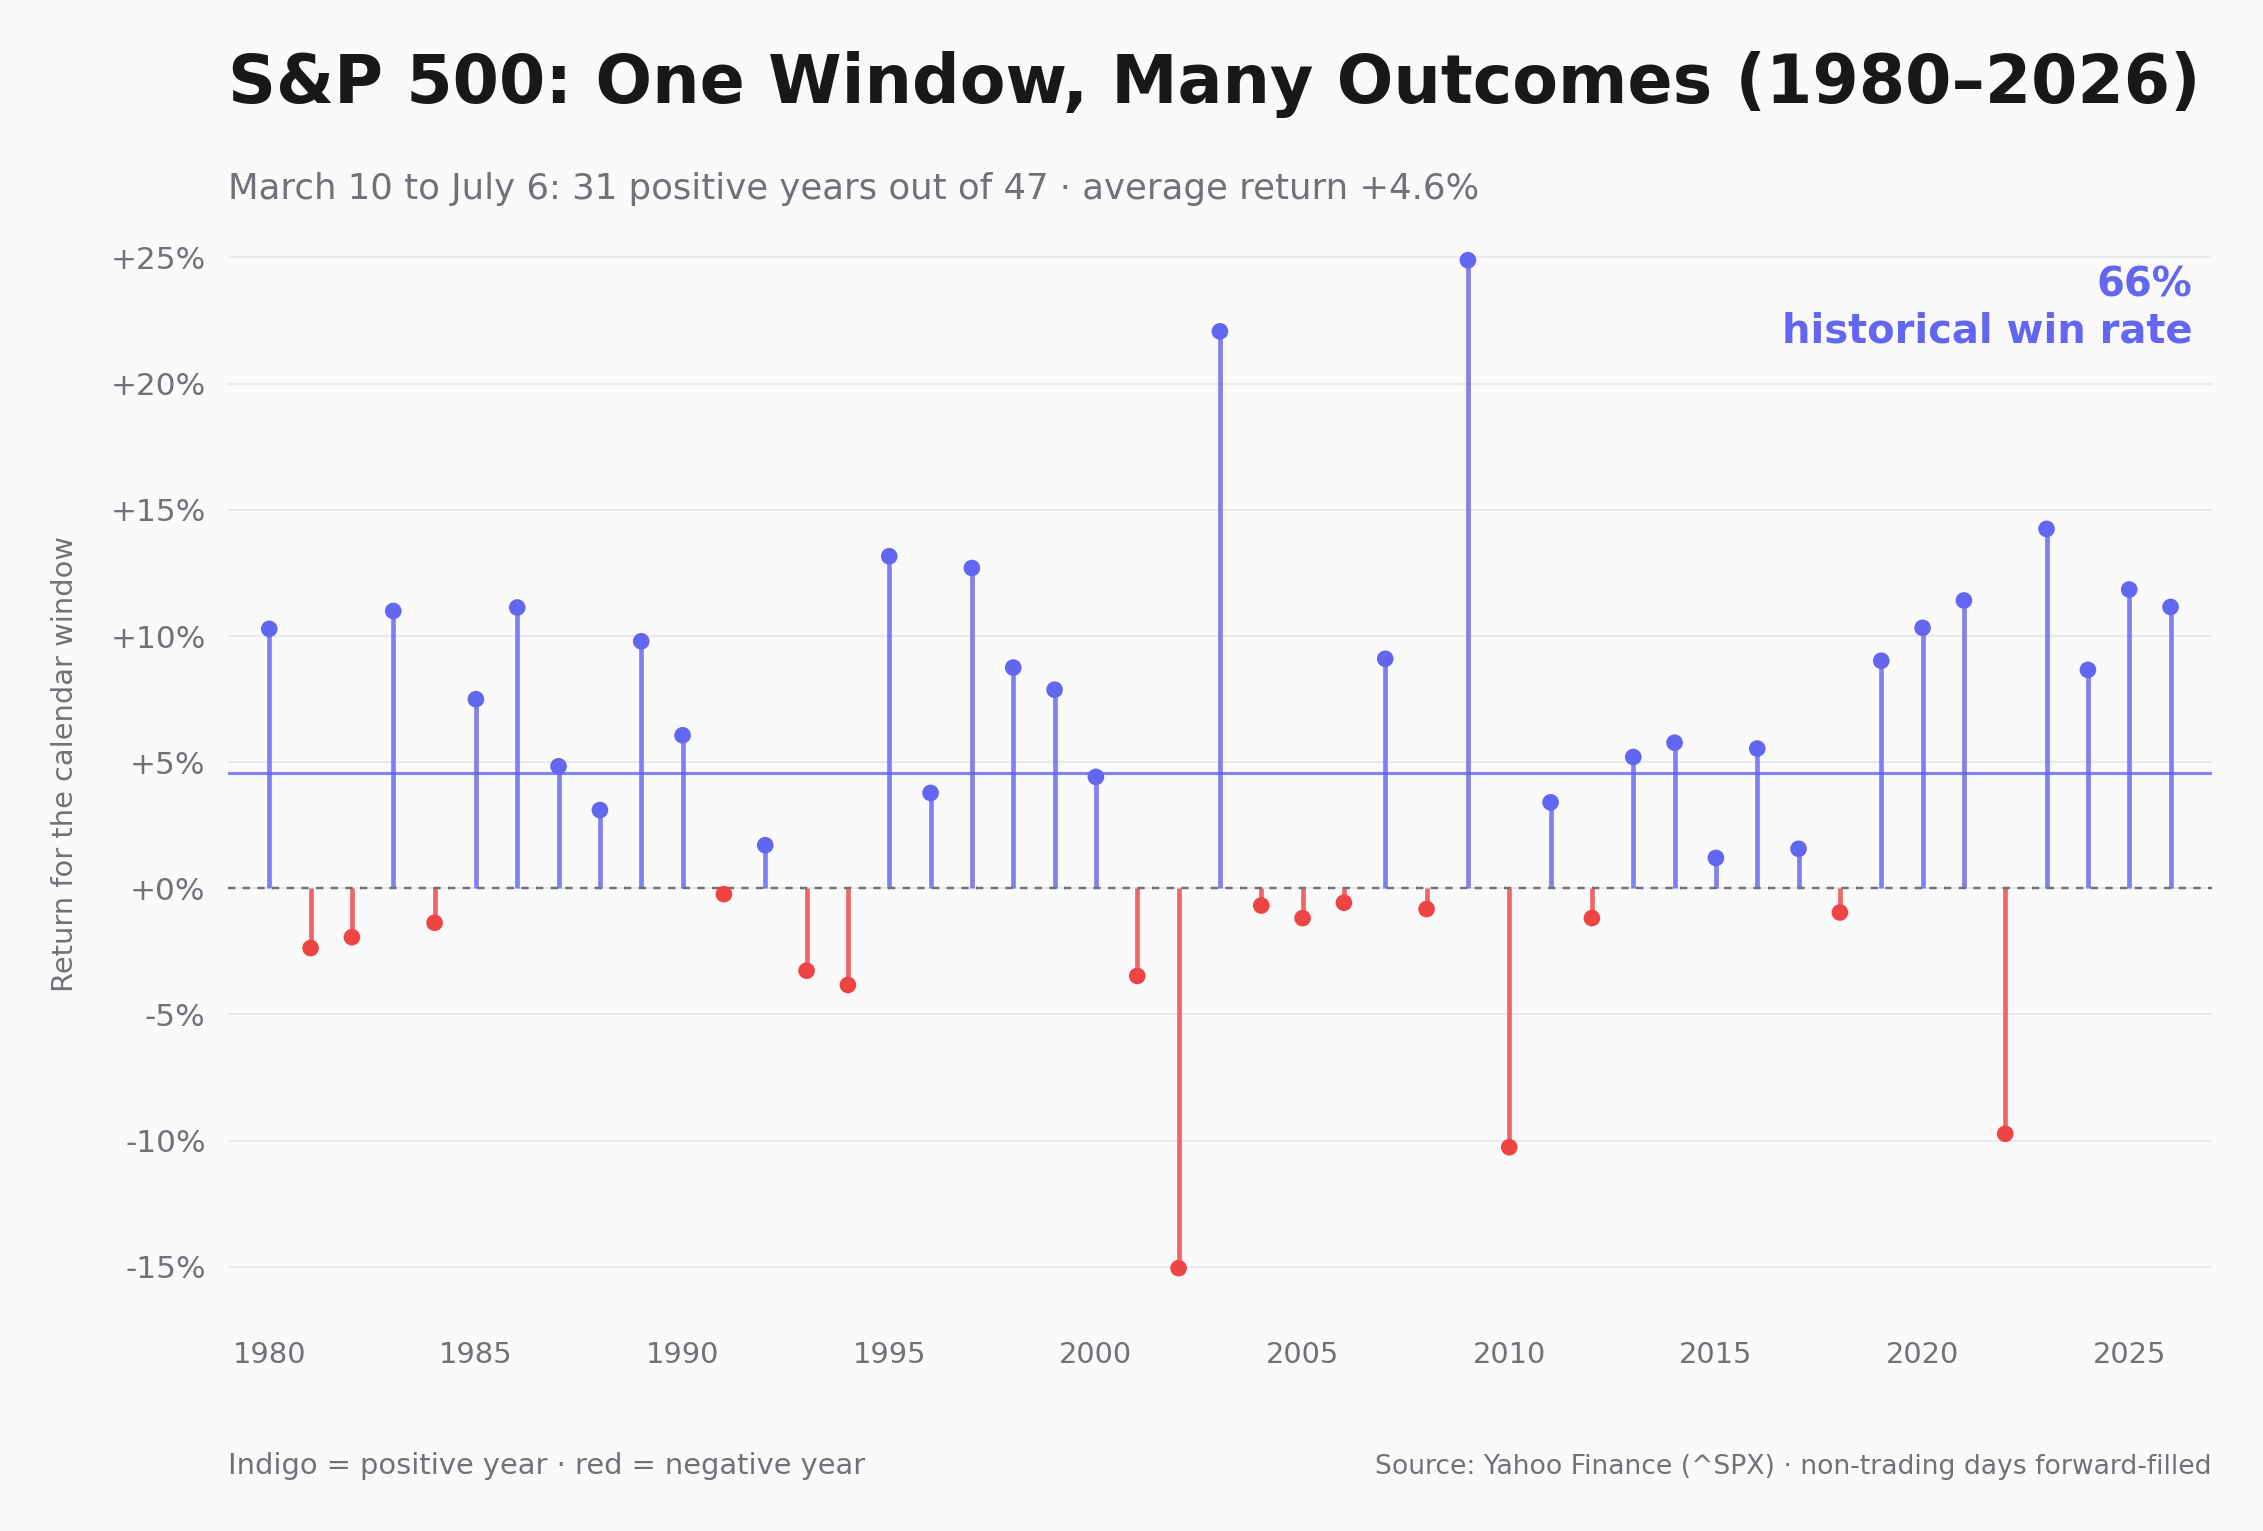
The chart above uses a fixed S&P 500 calendar window and shows the return for each individual year. The point is not that this window should be traded. It is that a single average hides a wide range of lived outcomes. Some years finish positive. Some do not. The average is real, but it is not the whole story.
A backtest is a question generator
A rising equity curve can make a simple rule look more robust than it is. That is why backtests are easy to overread.
The useful question is not “Did the line go up?” It is “How did it get there?” Ask what was tested, how many observations are in the sample, where the drawdowns occurred, and whether a few periods supplied most of the gains.
A strategy that looks smooth in an average chart may have been uneven in real time. A strong total return can coexist with long flat periods or sharp losses.
None of this makes backtesting pointless. It makes it more valuable. A good backtest gives you a structured way to challenge an idea before you become attached to it.
Use seasonality as a filter, not an instruction
The healthiest role for a historical pattern is to narrow the research process.
You may already follow a company because of its earnings, valuation, product cycle, or technical setup. A seasonal window can add one more layer of context. It might suggest that the period ahead has historically been favourable. It might point in the other direction. It might show too little consistency to matter.
In each case, the decision remains yours.
- Define the exact historical window.
- Check the number of years in the sample.
- Read the losing years, not just the average.
- Compare long-term and recent history.
- Consider current market conditions independently.
- Decide whether the pattern deserves further attention.
Sometimes it will. Often it will not. That is not a failure of the research. It is the research doing its job.
MarketOdds does not publish buy or sell calls. It gives users a way to inspect historical behaviour under explicit rules: dates, sample size, win/loss history, average outcomes, and backtests.
Try it with a company you already know. Review the window, then look for the reasons it may not repeat. That habit is more useful than treating any historical percentage as a promise.
Look at the window, not just the headline.
Compare seasonal history for a stock you already follow, then decide whether the context is worth further research.
Historical patterns describe past market behaviour. They do not predict future returns and are not investment advice.