

Research workflow
From a Stock Idea to a Data-Backed Research Process
A practical workflow for researching a stock idea with historical context, seasonal windows, weak periods, and current-market awareness.
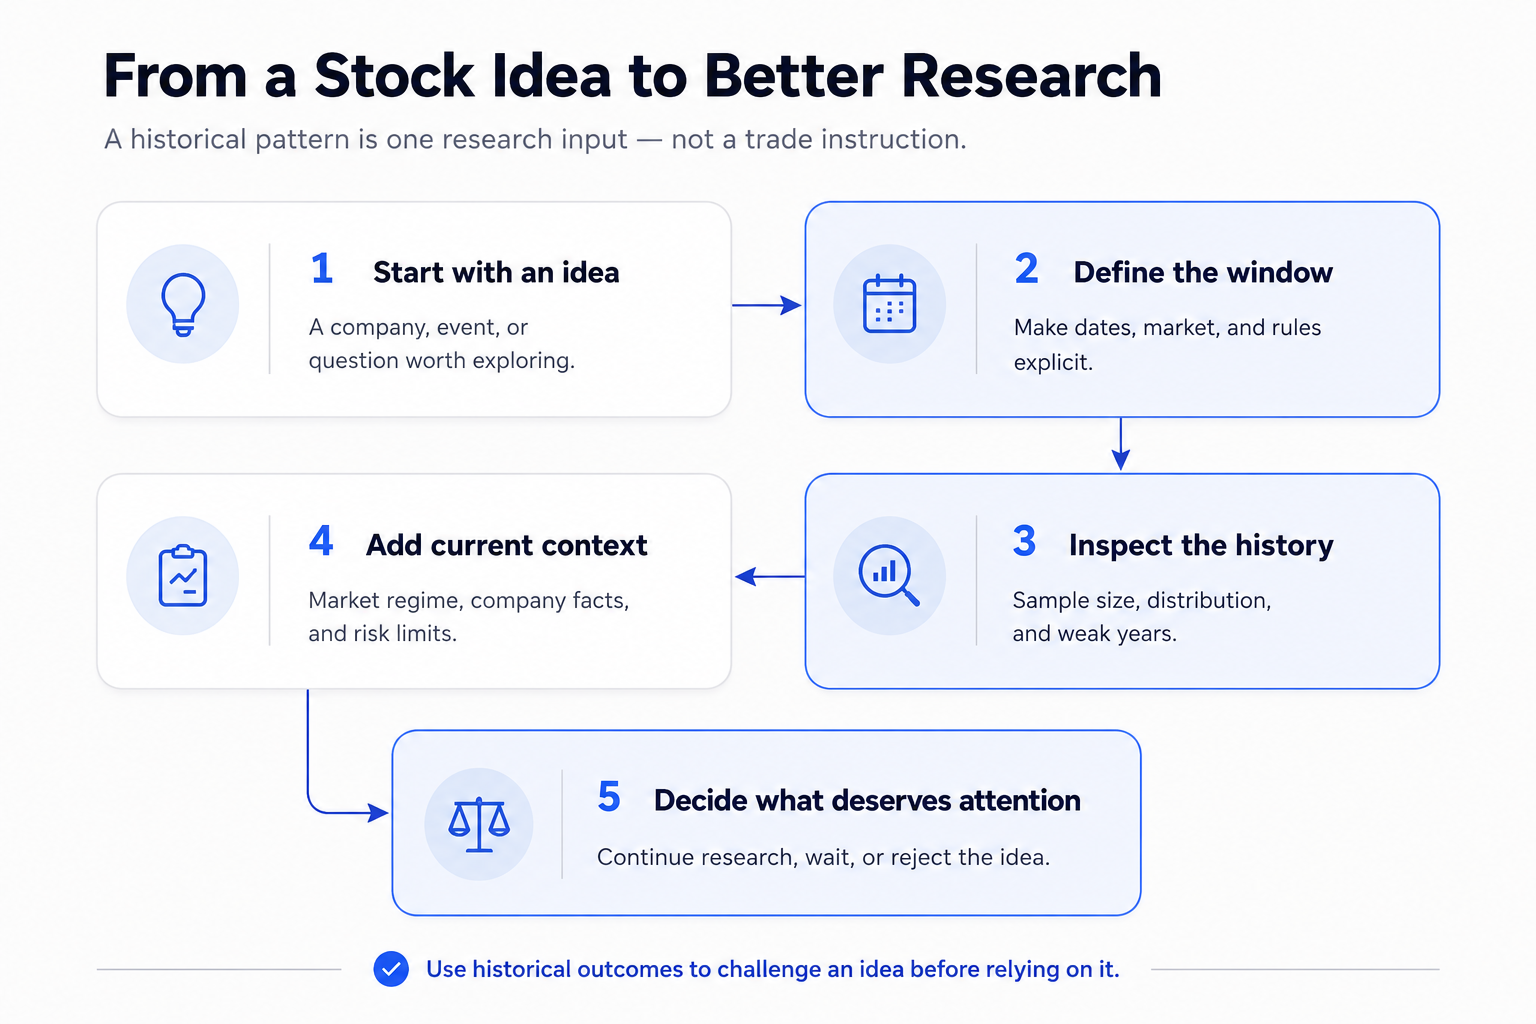
Most stock ideas begin with a fragment.
You notice an earnings trend, a product launch, an unusual chart, or a company you already know well. That can be a useful starting point. It is not a complete research process.
The next step is not to search for a statistic that confirms the first impression. It is to turn the idea into a set of questions that can be checked.
MarketOdds helps you inspect historical seasonal windows, their annual outcomes, and the periods in which they failed. It does not turn the result into a buy or sell instruction.
Start with a question, not a conclusion
“I should buy this stock” is a conclusion. “How has this stock behaved during this exact period across past years?” is a research question.
The difference matters because the second question leaves room for an uncomfortable answer. The historical record may be mixed. The sample may be too small. The recent years may disagree with the long-term average. That is useful information.
Write down what attracted your attention, then separate that observation from the test you want to run.
Define a window you can explain
A seasonal study needs a clear start and end date. If the dates cannot be explained or inspected, the result cannot be trusted.
Use Ticker Analysis to choose the stock and examine historical windows. Then ask:
- What exact dates are being tested?
- How many years are included?
- Does a small change in dates change the result substantially?
- Is there a practical reason for the window, such as earnings timing, industry seasonality, or a recurring business cycle?
The purpose is not to discover a perfect date. It is to make the rule visible enough to challenge.
Read the history below the headline
A positive average return or high win rate may get your attention. It should not be the final decision.
Look at each year. Identify the worst outcomes. Notice whether a few exceptional gains drove the average. Compare the full history with more recent periods. A result that appears stable over many years may deserve more research; a result driven by a few outliers needs more caution.
The annual distribution gives the number context. It shows the difference between an attractive summary and a history that would have been difficult to hold in real time.
Compare the pattern with the market environment
Historical windows happen inside market regimes. A pattern that performed well through low inflation, falling rates, or a particular sector cycle may behave differently when those conditions change.
That does not make history irrelevant. It means the history needs context.
Look for the years when the pattern struggled. Was the broader market under pressure? Did company-specific fundamentals change? Was volatility unusually high? These questions turn a backtest from a static chart into a useful research tool.
Keep separate evidence separate
A seasonal pattern is one kind of evidence. Earnings, valuation, balance-sheet risk, industry conditions, price trend, volatility, and personal risk limits are different kinds.
The idea brings you to the research. The research decides whether the idea deserves more attention.
Do not let a historical statistic replace the rest of the analysis. It is better used as an additional filter. If the historical window is weak, that may be a reason to wait. If it is strong but every other part of the analysis disagrees, the seasonal result does not overrule the rest.
A repeatable workflow
- Start with a stock you already want to understand.
- Define an exact historical window.
- Inspect the sample, distribution, and weak years.
- Compare the history with current market and company context.
- Decide whether there is enough evidence for further research.
This does not produce certainty. It produces a more disciplined way to work with uncertainty.
For public examples, explore the historical pages for Microsoft, NVIDIA, or Amazon. To look across current setups, visit Opportunities.
Look at the window, not just the headline.
Compare seasonal history for a stock you already follow, then decide whether the context is worth further research.
Historical patterns describe past market behaviour. They do not predict future returns and are not investment advice.